Network Analysis Tools
Acquire a basic understanding of a number of network analysis tools to gain a comprehensive lens of available resources. The most appropriate will be used to create the end product.
“Abydos,” The Emma B. Andrews Diary Project
Gephi
Although I have experience with data visualization software, this was my first encounter with Gephi, an open-source network analysis and visualization tool first introduced in 2008. Informed by Ken Cherven's Mastering Gephi Network Visualizations, I'll illustrate my learning process through week four below.
Overhead View

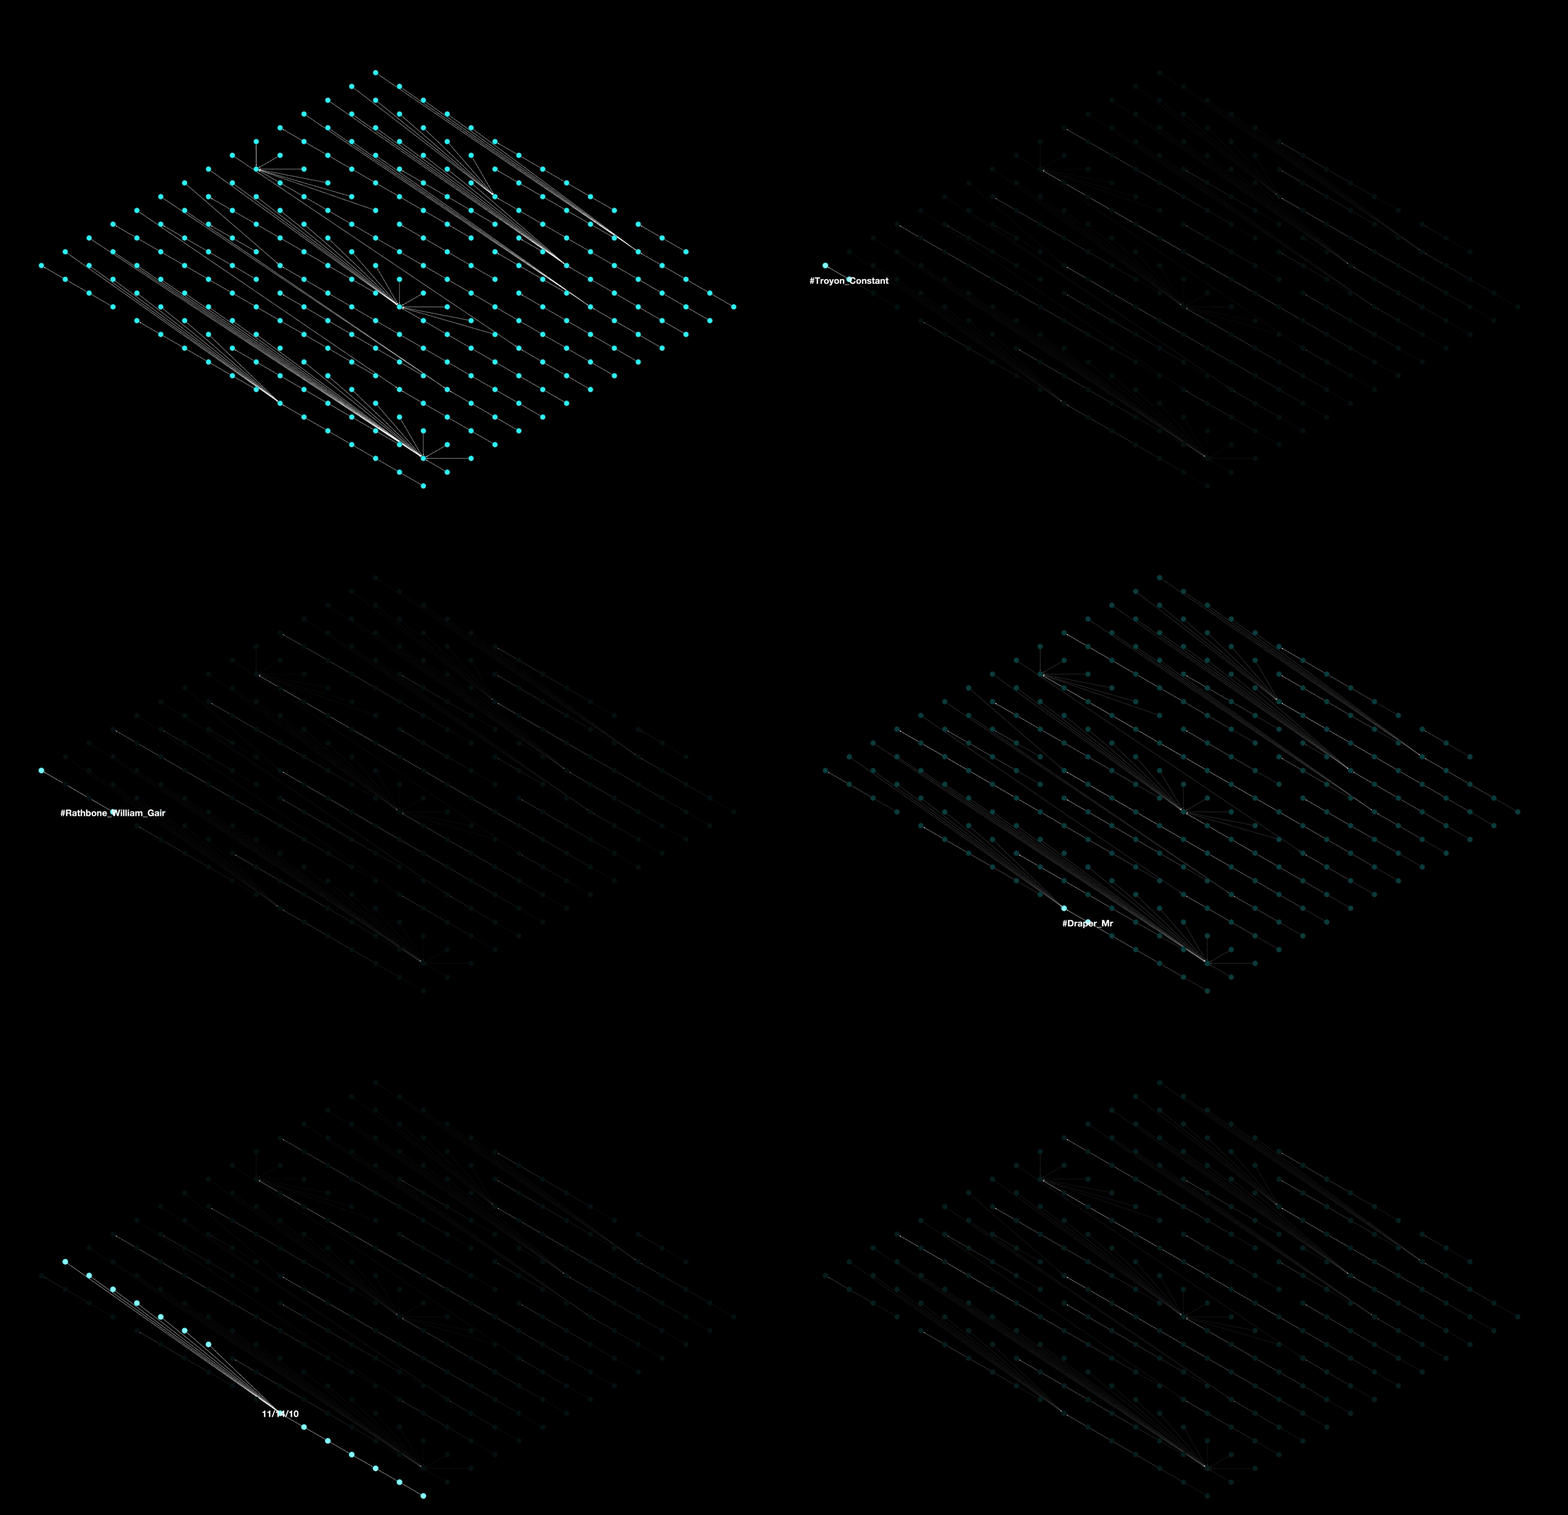
Approximating the Overhead View from the prototype video seemed like a good entry point to begin working with Gephi. Although the data set was larger than the Fields View(s) there was less manicuring involved in the process as it would be based off of the network CSV file that James Tucker had already worked up for our project.
Example of the original network CSV document
All that was needed for this process was to create an id field which would be used to create the nodes, the date ranges and TEI designations for the people would go under labels, associated excerpts from the diary under text and James' sentiment analysis under att (attribute). The separate edges (or lines) CSV file was prepared by connecting the source (date) with the target (person) as it was recorded in the text.
Document adjusted for node import
Edges that connect with nodes and continue to travel are undirected, as opposed to directed relationships, where the node is the edge's final destination. Because all of these relationships were between a person and a definitive date, I believe these are all direct node/edge relationships in both the Overhead and Fields View.
Document adjusted for edge import
Fields View

The Fields View had a theoretical component in addition to this technical process. One of the main objectives of the project is to marry the computational linguistics of the 19 EBA volumes with the valuable biographical research that has been performed by the repository's historical figures. An abridged version of this work has been collected in the Master Indices document, which was shared at the beginning of the quarter.

J.P. Morgan
Using the occupation and biographical notes sections of this document, I was able to identify the following 15 field categories:

Out of the roughly 950 people in the Master Indices, only 240 were able to be clearly identified within these fields. There are many sensitive, evidence based decisions that need to be made when assigning historical figures into a particular field and much of my reading material for this week was on the theory of historical social network analysis in order to inform these decisions.
One complicating factor is that many figures in the diary were 'multi-hyphenates,' in modern parlance. Sometimes to a dubious degree in the case of Arthur Weigall, an"egyptologist, anthropologist, stage designer, author, and journalist" who somehow found the time to have tea with Emma along the way. I used economics as a determining factor in some of these decisions where "Lawyer, amateur antiquities dealer" would be categorized under lawyer, as that was likely where the figure derived most of their livelihood.
Another economic complication in the designation of fields were the semantics of the time. A civil engineer or a marine biologist is a fairly objective designation which usually involves specific formal education. Contrast this with the many amorphous occupations of the early twentieth century generational elite where a world traveler, aristocrat, heiress and socialite may be used interchangeably.
I also put consideration into the the wives and spouses of men associated with particular fields also being included in those categories. Since we are constructing a social network analysis and spouses were often close companions and dining partners during these trips to Egypt, I felt that these partners were likely to have had an influence on the field even without directly taking part in the work.
Sarah Ketchley also discussed possibly using a weighted system for distinguishing the fields of each person that might be assigned to multiple categories, such as Mr. Insinger, banker: 6, photographer: 2, antiquities dealer: 2. That said, we didn't explore if the numbers designated how much time the person assigned to those fields in their lifetime, or another possible perspective, the impact that those people had on the field during and after their life.
For the purposes of this exercise, I feel satisfied with the current rubric as a means of producing a proof of concept for the network visualization. I am also happy that this initial model for the rubric has sparked a conversation into how future iterations could expand and refine this process.
15 Field Categories with color coding used for sorting within the Master Indices document
Once these field designations were assigned, I separated the sections using color coding. I manicured this information for the nodes CSV, retaining occupation as the attribute and biographical notes as the text.
Original Master Indices Document of Royalty
Finally, I reformatted edge documents so the volume would be the source and the target the tagged people in order to track the associated fields over time. This was more complicated than I would have guessed beforehand. The action required using Excel's text to column feature to expand the associated volumes and then recombine the comma separated values to be compatible with Gephi's import functions.
Formatted Edge Import Document of Royalty
Once all 15 categories were completed, I exported this data to CSV in individual files for future use.
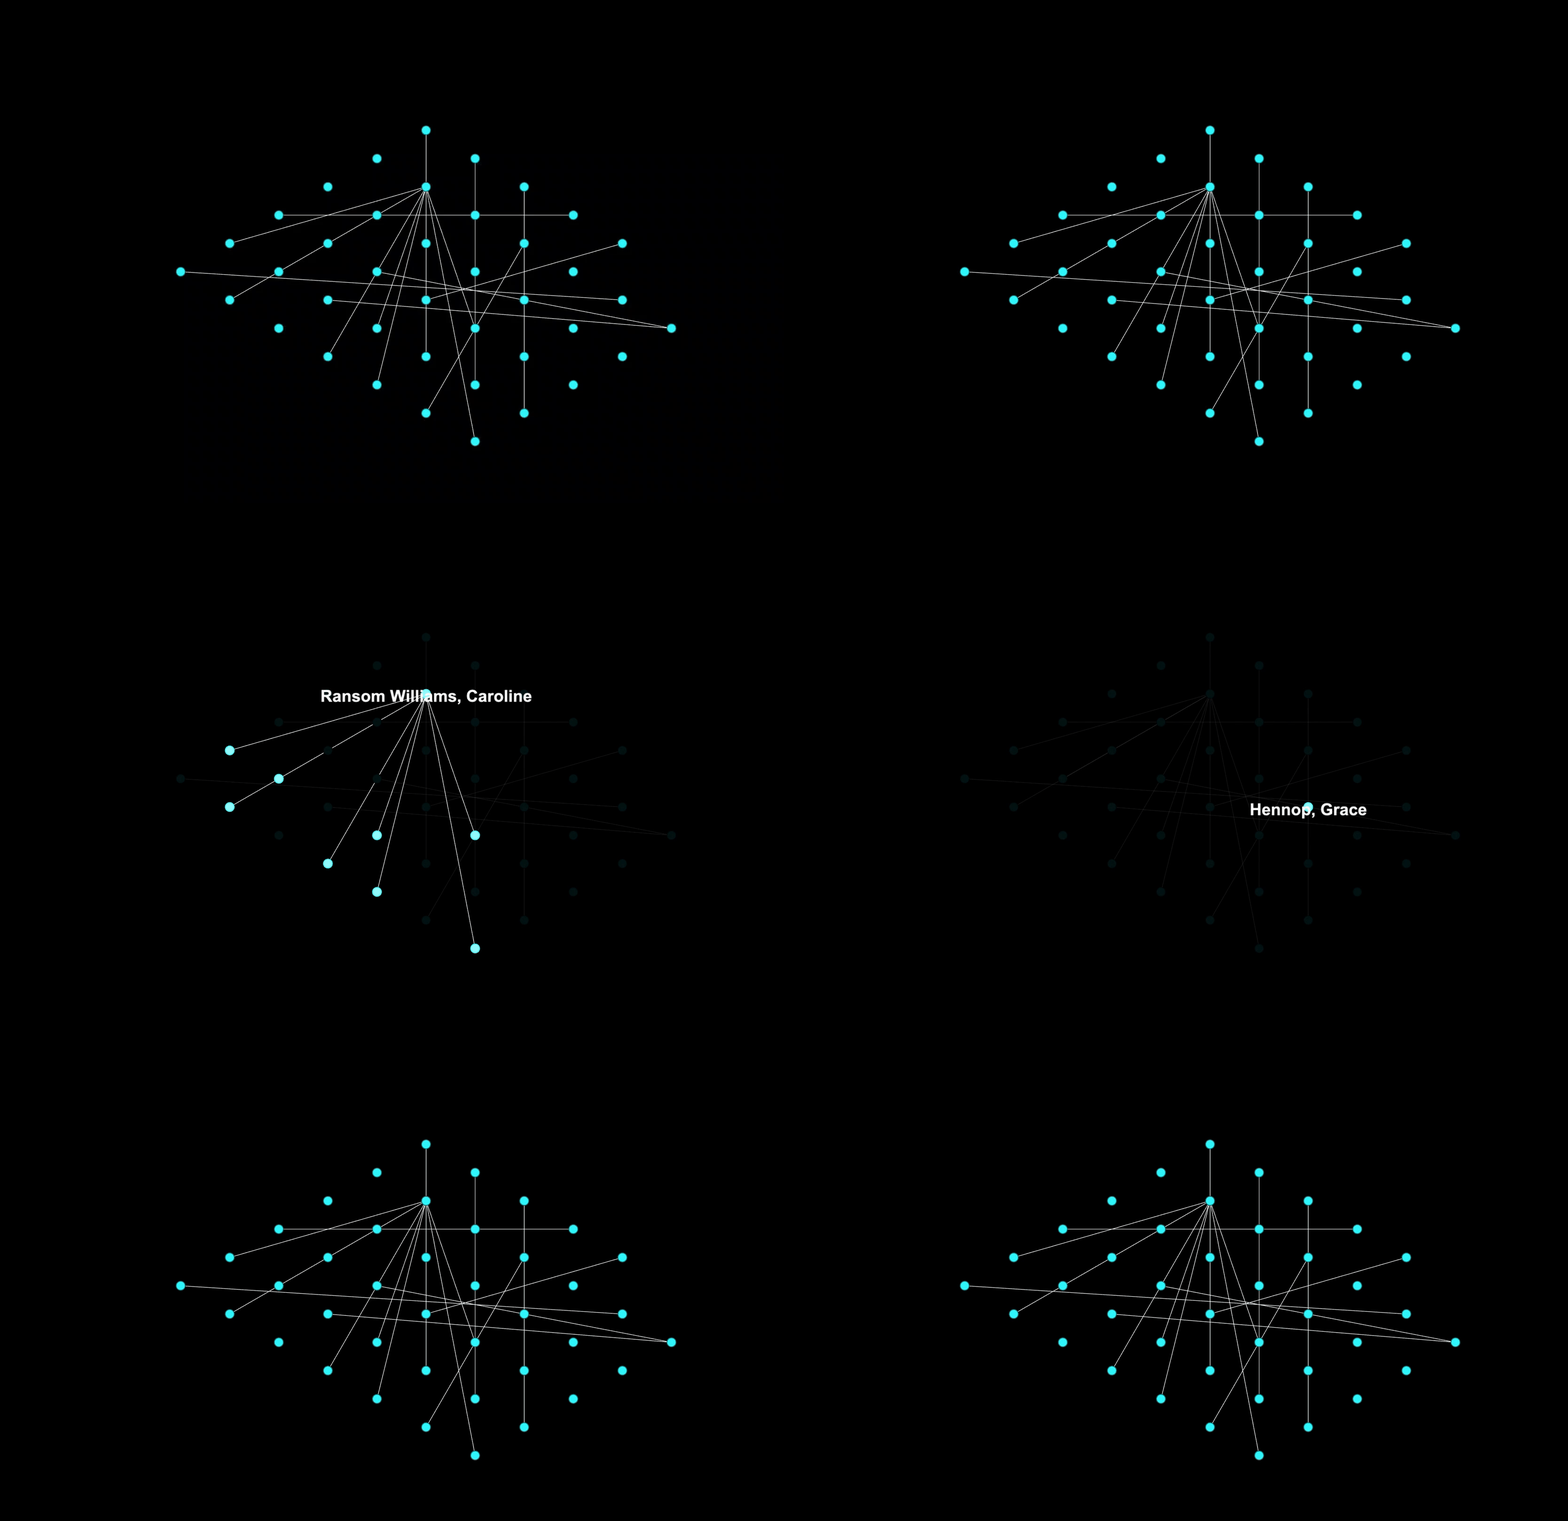
After a fair amount of roadblocks and finger crossing, I completed the following visualizations in Gephi:

Initial Volume 17 network visualization

Later Volume 17 network visualization with edited CSV composition

Volume 17 network visualization interactivity

Archeological, Anthropological and Geological Fields network visualization interactivity
Regardless of whether we continue to use Gephi as our data visualization software, these refined data sets will continue to have value on other platforms. I plan on expanding on these examples by implementing sizing and color coding of the nodes depending on the attributes of the person and possibly creating a large scale dynamic graph of all of the fields together, showing how each field fluctuates over time.
Harvard professor and Egyptian Art Curator Albert M. Lythgoe, whose picture is on the menu of my Reflections page, is recounted in J. Pierpont Morgan: Financier and Collector stating in 1906 that "the combination of other excavators clearing ancient sites and raids by local thieves meant that the best material would be gone in fifteen years." I feel this quasi land rush could be interestingly and accurately portrayed by the proposed dynamic visualization, seeing the nodes of the particular fields expand and recede as Egyptology evolved from a rough hewn interest of science and engineering to an exotic art collecting prospect for the Gilded Age's elite.
References:
Strouse, Jean. “J. Pierpont Morgan: Financier and Collector.” The Metropolitan Museum of Art Bulletin, vol. 57, no. 3, 2000, p. 1. DOI.org (Crossref), doi:10.2307/3258853.